Image
A guide to drawing and manipulating images with NumPy and Matplotlib.
[1]:
import numpy as np
import matplotlib.pyplot as plt
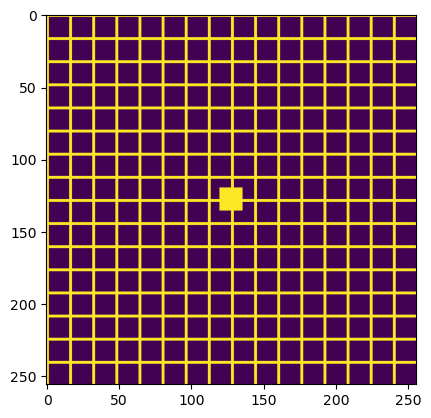
Grid pattern in plt.imshow
Create a grid pattern with horizontal and vertical lines, plus a distinctive marker in the center.
[2]:
# Ground truth: grid pattern
size = 256
ground_truth = np.zeros((size, size))
for i in range(0, ground_truth.shape[0], 16):
    ground_truth[i:i+2, :] = 0.5  # horizontal lines
    ground_truth[:, i:i+2] = 0.5   # vertical lines
# Add a distinctive marker in the center
cx, cy = ground_truth.shape[0] // 2, ground_truth.shape[1] // 2
ground_truth[cx-8:cx+8, cy-8:cy+8] = 0.5
plt.imshow(ground_truth)
plt.show()